Are you still looking for the right e-commerce type? Or are you still looking for your own entrepreneurial direction? However, there is no suitable data to demonstrate whether the goods are suitable, recommend the United Nations Customs import and export data(UN comtrade database), which can find the import and export data of various countries, and give you the import and export data you need to show the degree of competition in the category you choose.
The following is my list of the customs import and export data of wholesale bluetooth speakers in the world’s most major economies, which can intuitively display the basic production and sales of wholesale bluetooth speakers.
We inquire the import and export data of 2023 according to the customs HsCodes. There are three HsCodes under the category of speakers, which are 851821,851822,851829, among which 851829 is mainly speaker accessories, and we will not do statistics this time.
2023 US Wholesale Bluetooth Speakers Imports Data
As the world’s largest trading market, the United States basically imports low-end manufacturing products from around the world, and the size of the US market can be measured by the amount of imports.
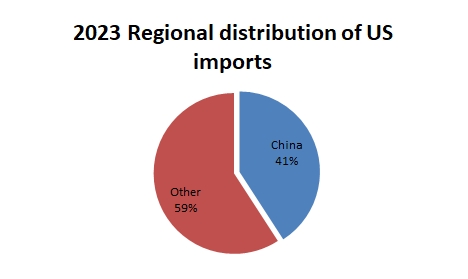
In 2023, the total amount of imported Wholesale Bluetooth speakers in the United States is $3038814,944, the import amount of single-speaker speakers is $794,662,139, and the multi-speaker speakers are $2244152805. Among them, the total amount of Wholesale Bluetooth speakers imported from China is $1241096760, single-speaker speakers are $384275239, and multi-speaker speakers are $856821521.Wholesale Bluetooth speakers imported from China accounted for 40.8% of U.S. imports.
| Period | Reporter | Partner | Commodity Code | Trade Value (US$) |
| 2023 | USA | World | 851821 | 794,662,139 |
| 2023 | USA | World | 851822 | 2,244,152,805 |
| 2023 | USA | China | 851821 | 384,275,239 |
| 2023 | USA | China | 851822 | 856,821,521 |
| 2023 | USA | World | Total | 3,038,814,944 |
| 2023 | USA | China | Total | 1,241,096,760 |

2023 European Union Wholesale Bluetooth Speakers Imports Data
As an international market that can compete with the United States, the market size of the European Union deserves in-depth analysis by investors.
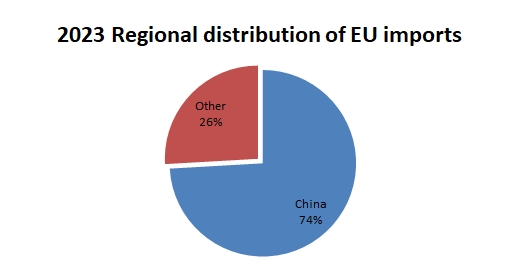
In 2023, the import amount of Wholesale bluetooth speakers in the EU is $158,585,962, of which the import amount of single-speaker speakers is $496,377,298, and the import amount of multi-speaker speakers is $109,2208,664. Among them, the value of imports from China was $11,765,8989, It accounts for 74% of total imports.
| Period | Reporter | Partner | Commodity Code | Trade Value (US$) |
| 2023 | European Union | World | 851821 | 496,377,298 |
| 2023 | European Union | World | 851822 | 1,092,208,664 |
| 2023 | European Union | China | 851821 | 361,052,351 |
| 2023 | European Union | China | 851822 | 815,906,638 |
| 2023 | European Union | World | Total | 1,588,585,962 |
| 2023 | European Union | China | Total | 1,176,958,989 |

2023 Australia Wholesale Bluetooth Speakers Imports Data
As the only continent in Oceania, the population size is objective, and it is also a market that investors can choose.
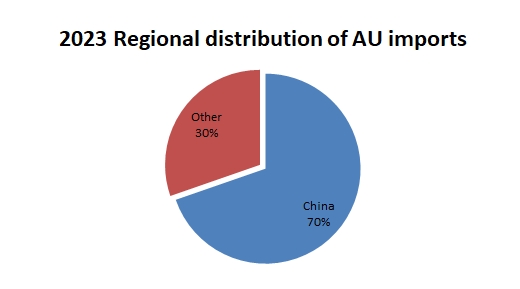
In 2023, the import value of Australian Bluetooth speakers is 29,435,967 US dollars, of which the import value from China is 205,102,434 US dollars, accounting for 70%.
| Period | Reporter | Partner | Commodity Code | Trade Value (US$) |
| 2023 | Australia | World | 851821 | 76,606,493 |
| 2023 | Australia | World | 851822 | 217,739,474 |
| 2023 | Australia | China | 851821 | 54,375,610 |
| 2023 | Australia | China | 851822 | 150,726,824 |
| 2023 | Australia | World | Total | 294,345,967 |
| 2023 | Australia | China | Total | 205,102,434 |

2023 China Wholesale Bluetooth Speakers Exports Data
From the China Customs, we have obtained a total of 283,1104,799 US dollars for the export of single speaker wholesale bluetooth speakers in China in 2023, 371,4335,963 US dollars for multi-speaker wholesale bluetooth speakers, and 266,4284,188 US dollars for horn accessories.
| Hscode | QTY | QTY Unit | Trade Value(US$) |
| 851821 | 307,380,647 | u | 2,831,104,799 |
| 851822 | 87,795,586 | u | 3,714,335,963 |
| 851829 | 1,619,373,848 | u | 2,664,284,188 |
In 2023, China’s top 20 regions for wholesale bluetooth speaker exports
The following are the top 20 regions for China’s export of Bluetooth speakers, which can also reflect the economic conditions of major economies from the side.The following data contains only hscode851821 and 851822.
| Period | Reporter | Partner | Trade Value (US$) |
| 2023 | China | USA | 1,548,941,135 |
| 2023 | China | European Union | 1,176,958,989 |
| 2023 | China | Russian Federation | 369,355,183 |
| 2023 | China | India | 216,350,522 |
| 2023 | China | Brazil | 198,209,203 |
| 2023 | China | Viet Nam | 180,627,295 |
| 2023 | China | United Kingdom | 158,073,102 |
| 2023 | China | Philippines | 151,668,857 |
| 2023 | China | Japan | 147,603,367 |
| 2023 | China | Thailand | 137,264,168 |
| 2023 | China | Australia | 129,601,207 |
| 2023 | China | Rep. of Korea | 123,266,670 |
| 2023 | China | Malaysia | 109,314,585 |
| 2023 | China | United Arab Emirates | 106,903,624 |
| 2023 | China | Mexico(exclusive851821) | 97,579,269 |
| 2023 | China | Canada | 96,358,344 |
| 2023 | China | Singapore | 92,741,945 |
| 2023 | China | Indonesia | 78,815,523 |
| 2023 | China | Kazakhstan | 76,981,099 |
| 2023 | China | Nigeria | 63,169,771 |
Of course, there are other emerging markets, but the data is relatively scattered, if you are interested, you can check on the UN website(UN comtrade database).

China is the largest manufacturing base and has the most factories. The size of the US market is unimaginable.
Could you please make statistics on the import and export data of the top 10 countries?
OK.
Worth reference.